Network Diagram
See everything on a client's office network, from the internet connection down to printers, and get told when something goes offline.
What the page is for
Network Diagram is a page in the Lavawall® console, in the Network area. Lavawall is the RMM, security, and compliance platform from ThreeShield, built and hosted in Canada. About this feature.
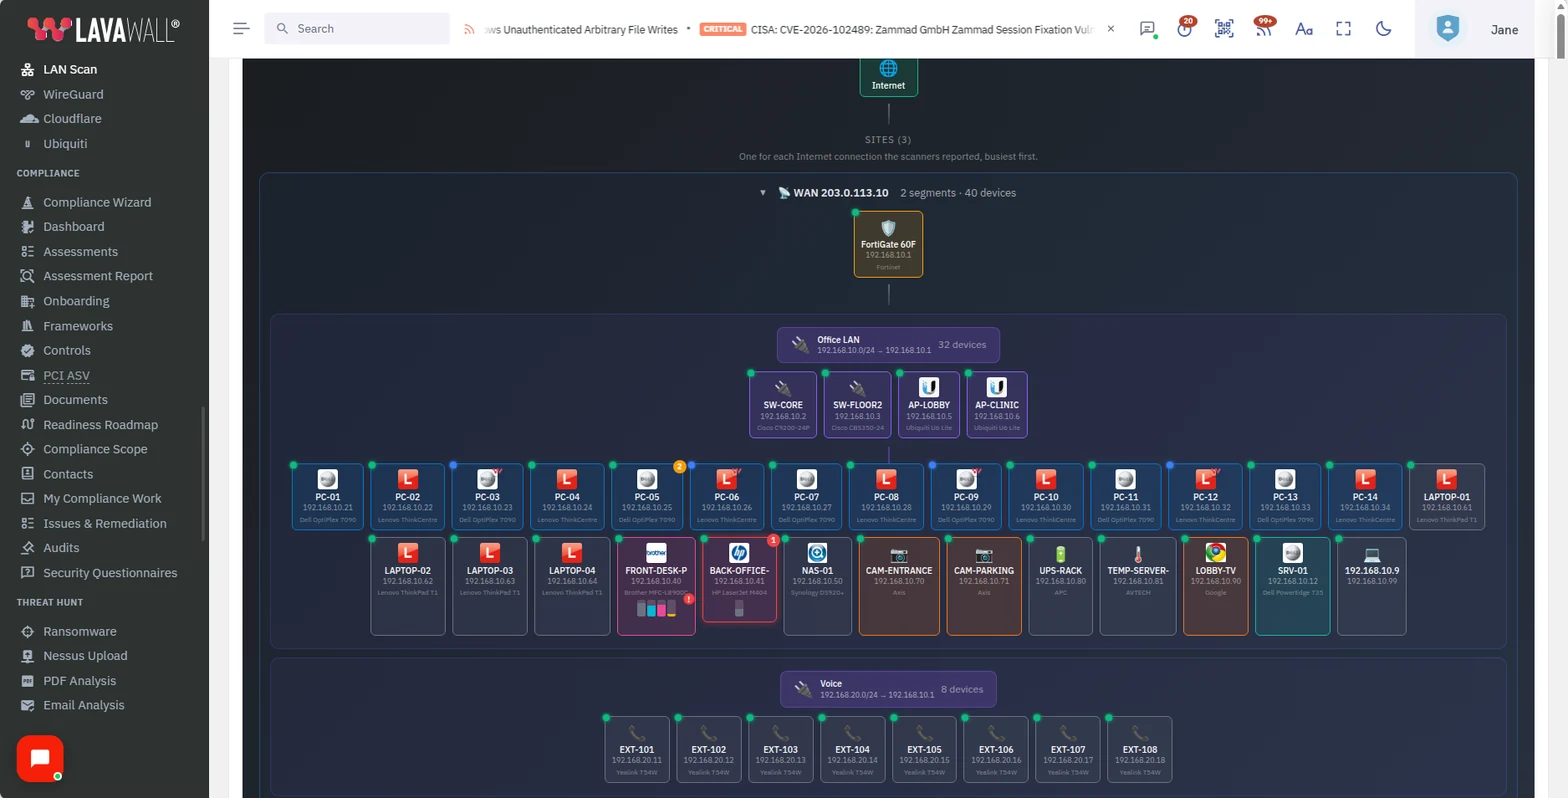
The Network Diagram uses computers running the Lavawall agent as scanners to discover the other devices on the local network: routers, switches, access points, printers, phones and anything else that answers. It draws them as a map from the internet, with one card for each site (each internet connection), its gateways, and the network segments behind them, and marks which devices are managed by Lavawall. Segments with nothing on them, such as a laptop's home or hotel network, are listed under the map instead of drawn.
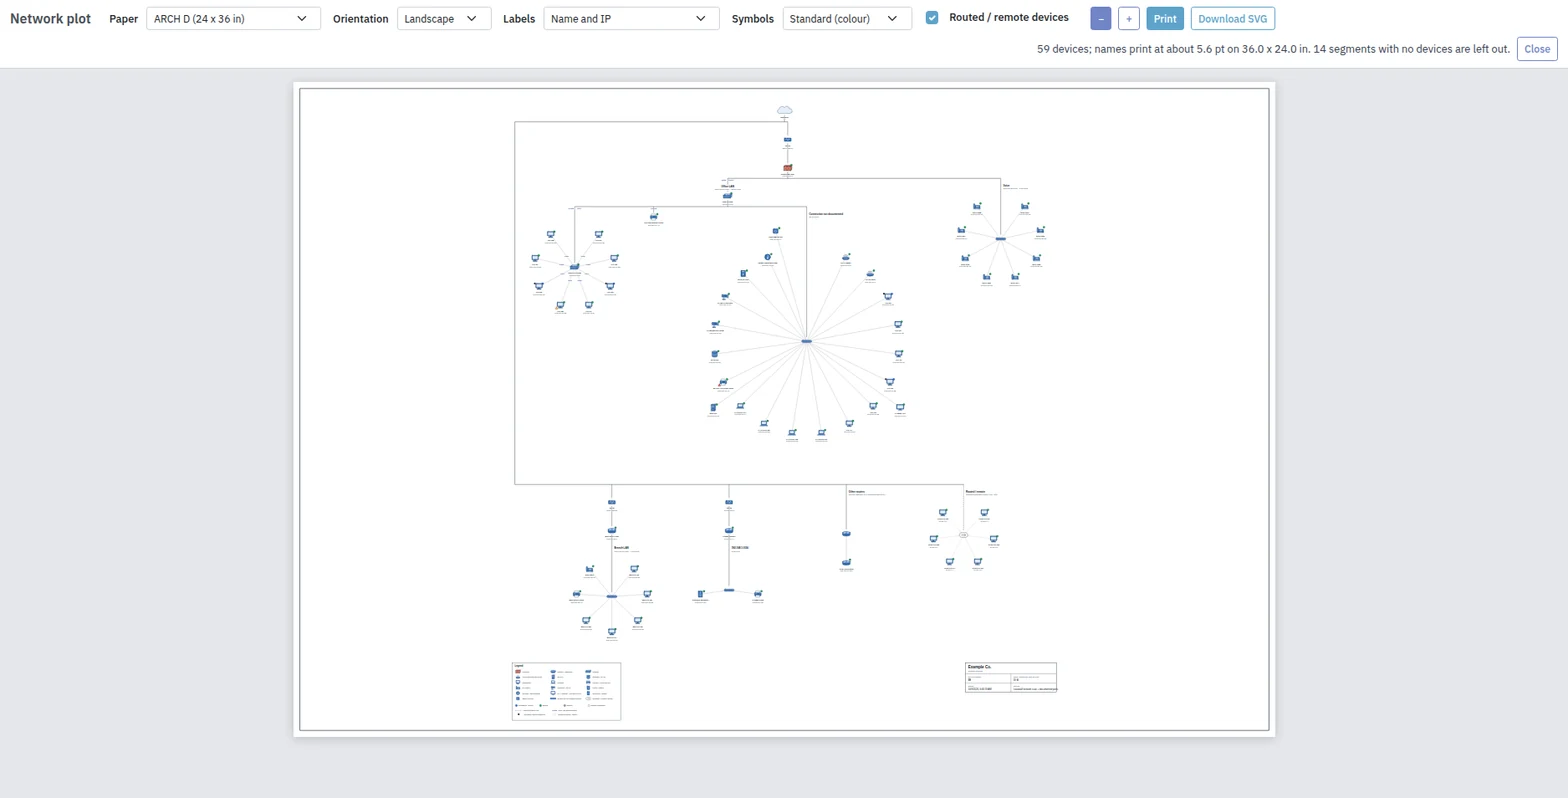
You can write down which switch port each device is plugged into, and print the whole network as a traditional network drawing on a plotter or large paper, or save it as an SVG file.
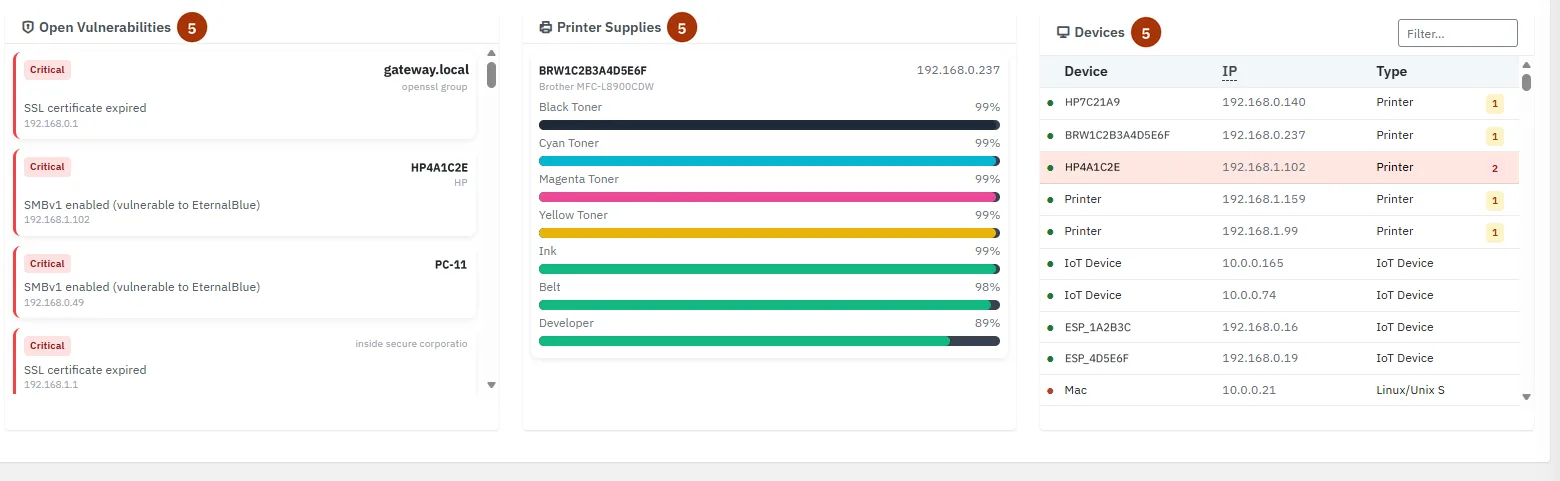
For each device it shows the IP address, type, open ports and, where the device supports SNMP, details such as interfaces, printer supply levels and environment sensors. Open vulnerabilities found on network devices are listed, as are printers with low supplies.
You can also turn on uptime monitoring for any device or for a URL or IP address. Lavawall then checks it on a schedule, records outages with the reason, shows an uptime heat map, and raises a notification when it goes down.
What you see
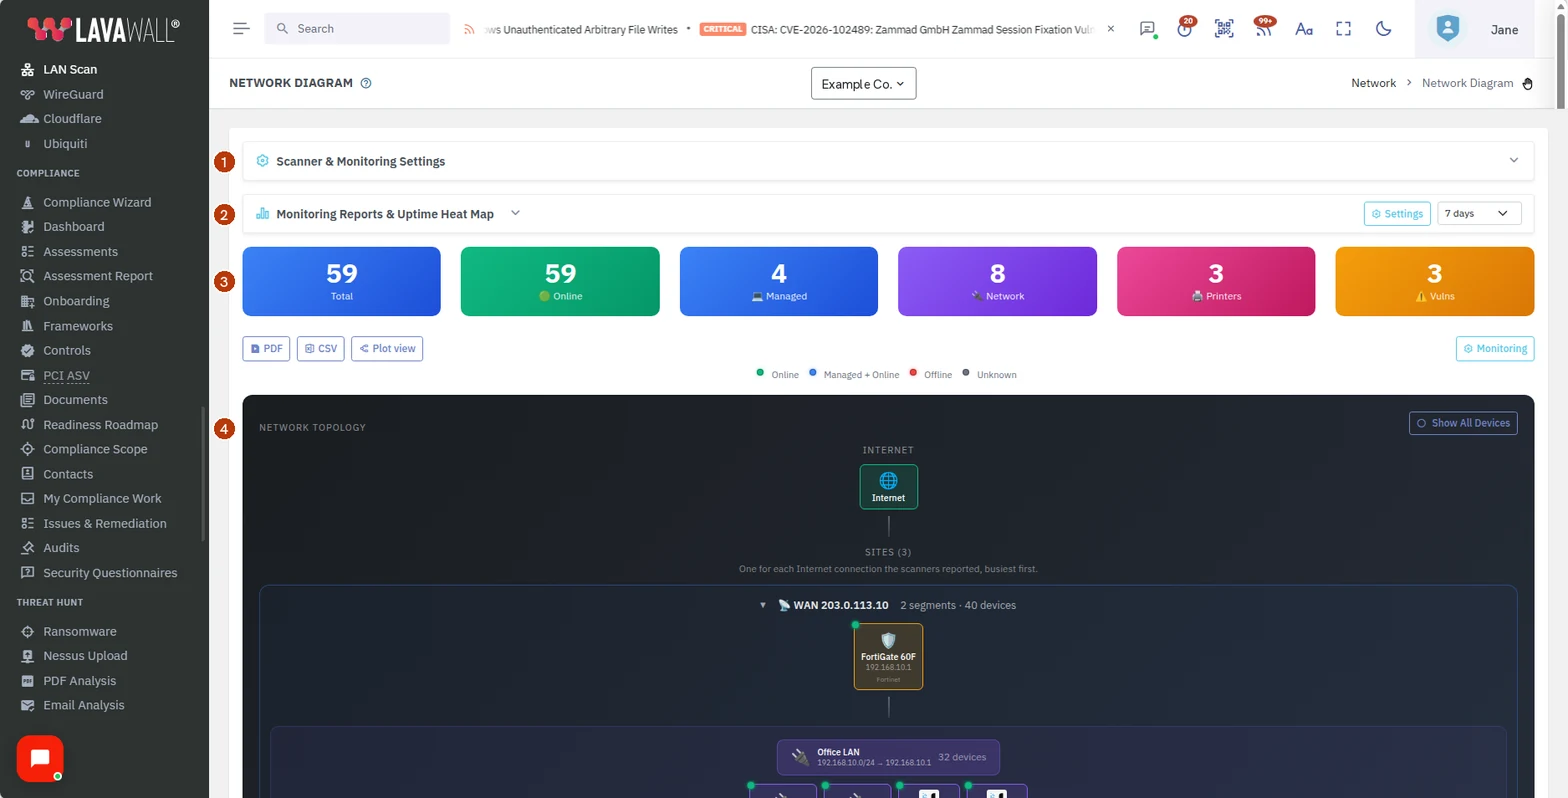
- Scanner & Monitoring Settings: which computers scan, how often, alert thresholds, SNMP communities and which locations may run monitoring.
- Monitoring Reports & Uptime Heat Map: monitored, online, offline and outage counts, an uptime heat map, and an outage list, for 24 hours to 90 days.
- Summary: Total, Online, Managed, Network, Printers and Vulns counts, with PDF, CSV, Plot view and Monitoring buttons.
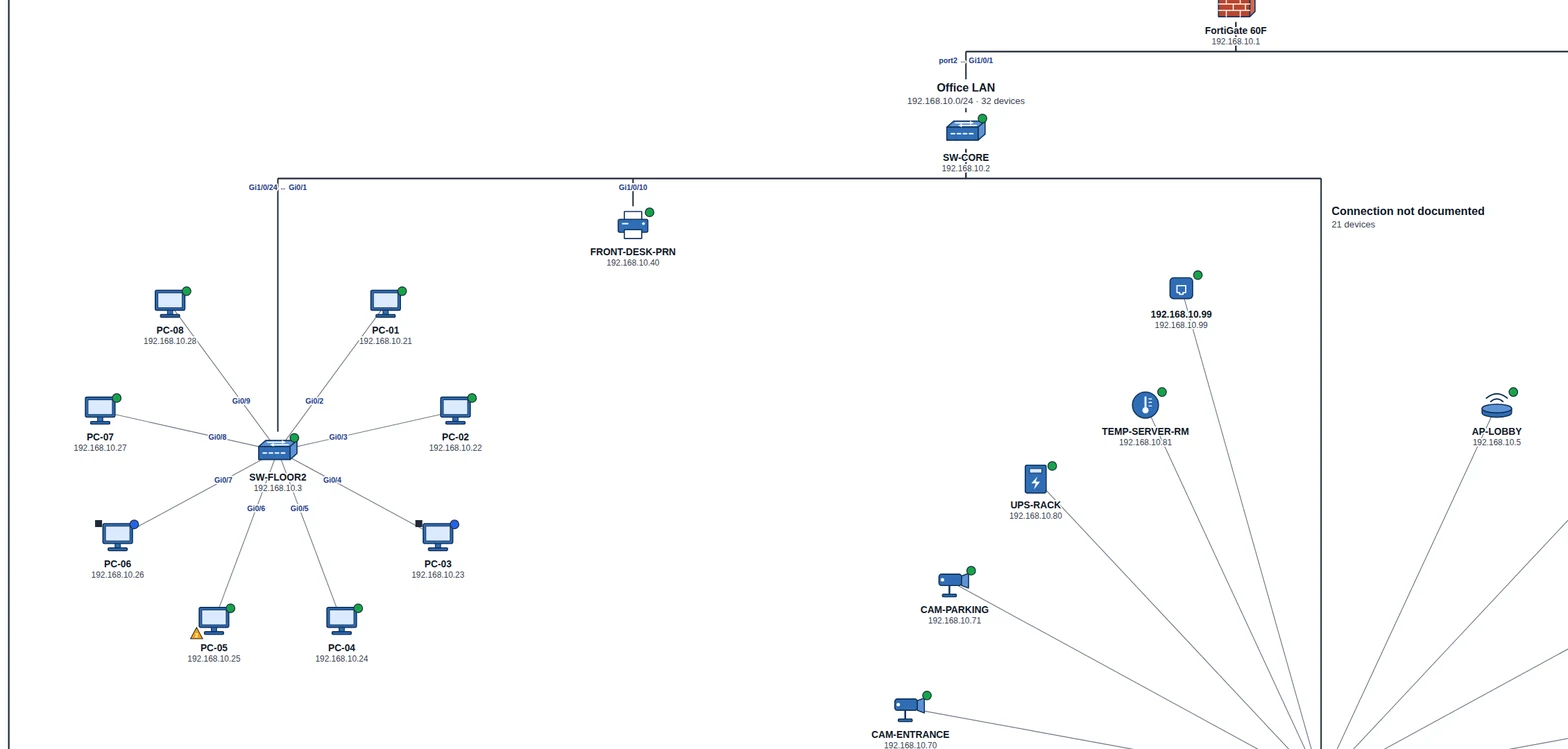
- Network Topology: the map from the Internet to one card per site. Each site shows its WAN address, its gateways and its network segments with their switches and devices. Below the sites are Other routers, Remote Devices - No ARP (devices reached through a router), devices with no segment, and a collapsed list of segments with no devices.
- Open Vulnerabilities, Printer Supplies and Devices: lists below the map.
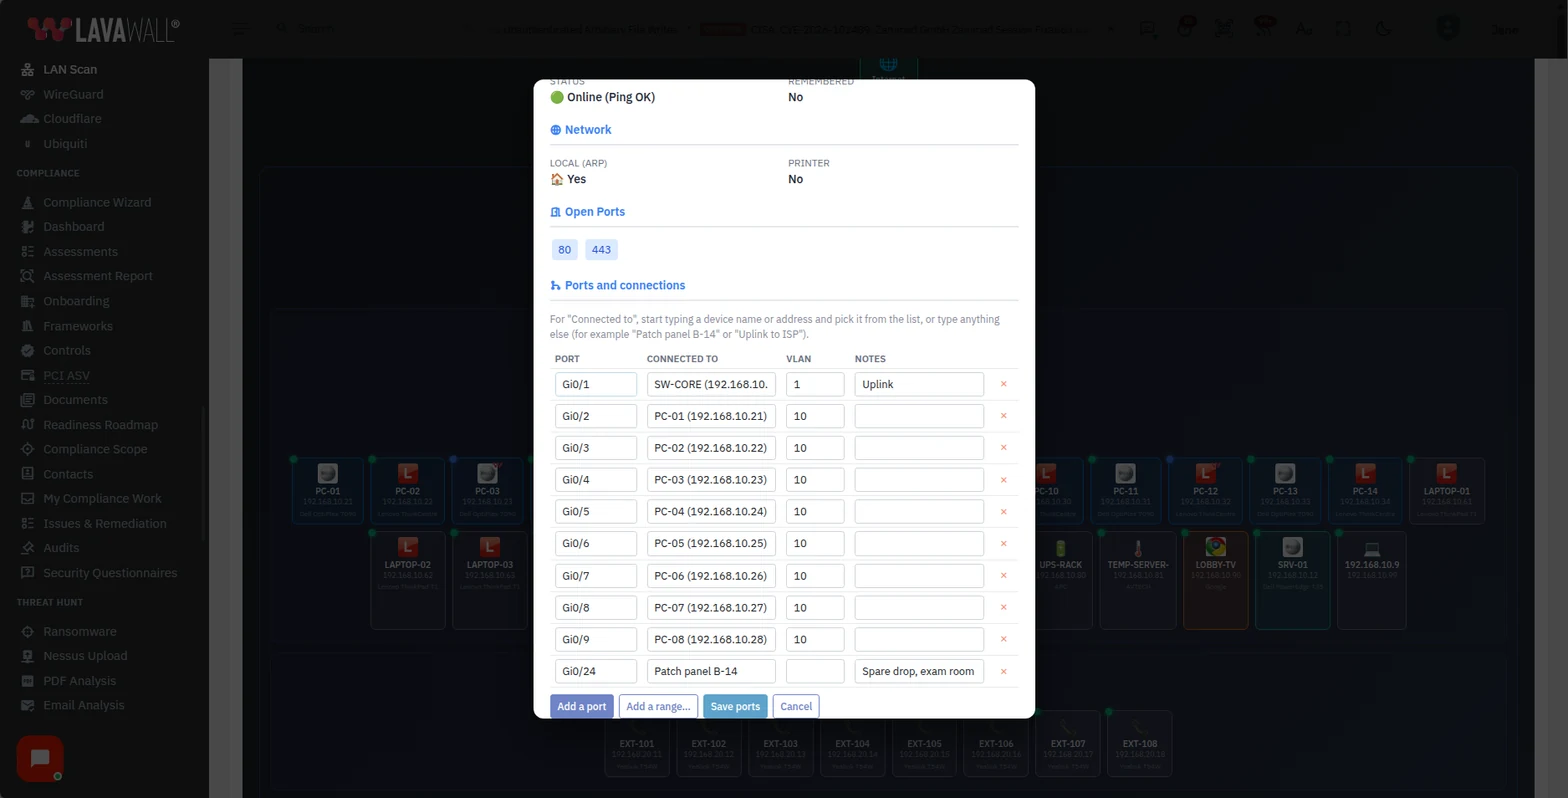
- Device Details: click a device to see basic information, network, open ports, SNMP information, vulnerabilities, printer supplies, network interfaces, environment sensors, and Ports and connections.
How to use Network Diagram
How to start scanning a network
- Select the company in the company picker.
- Open Scanner & Monitoring Settings. Leave Auto-assign ARP scanning on to let Lavawall choose scanners, or turn it off and tick the computers under Allowed scanners (manual assignment).
- Turn on Auto-assign subnet scanning if you also want whole subnets scanned.
- Under Intervals & Thresholds, set Consumable Alert, Monitor Check, ARP Scan and Subnet Scan.
- Enter your SNMP Communities (comma-separated) so printers and switches can be read.
- Click Save Settings. Devices appear after the next scan.
How to monitor a device for outages
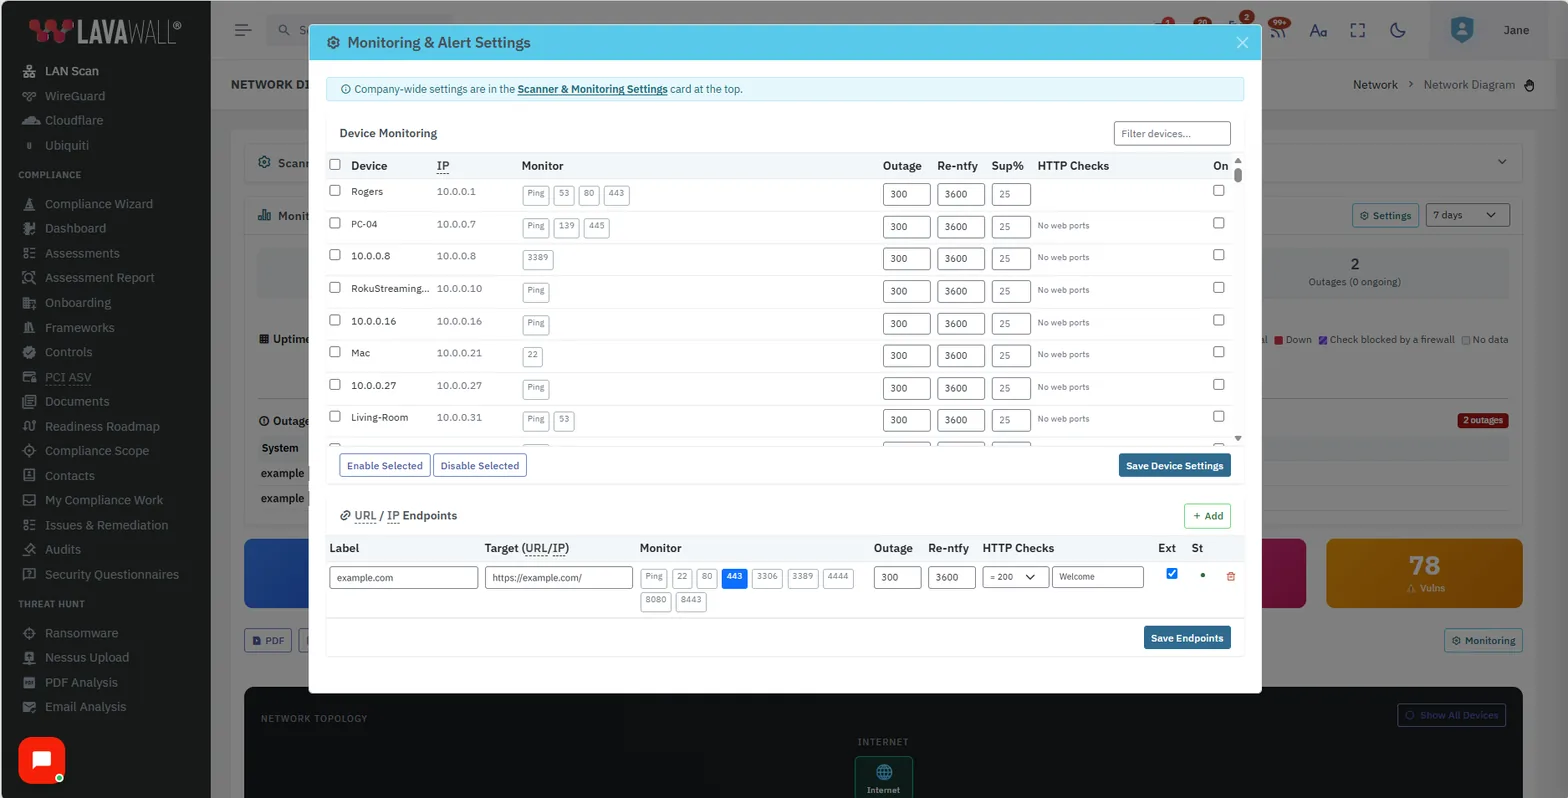
- Click Monitoring.
- In Device Monitoring, find the device with Filter devices..., choose what to monitor (for example ping or a port), set Outage and Re-ntfy (re-notify) times, and tick On.
- For a web port, add HTTP Checks, including a string that must appear on the page.
- Use Enable Selected or Disable Selected for several devices at once.
- Click Save Device Settings.
How to monitor a website or IP address
- Click Monitoring, then Add under URL / IP Endpoints.
- Enter a Label and Target (URL/IP), choose what to monitor and the Outage and Re-ntfy times.
- Tick Ext to allow any scanner, including Lavawall's servers on the internet, to check it.
- Click Save Endpoints.
How to review uptime
- Expand Monitoring Reports & Uptime Heat Map.
- Choose a period: 24 hours, 7 days, 14 days, 30 days or 90 days.
- Read the outage list: System, Started, Ended, Duration, Status (Ongoing or Resolved) and Why it was down. A source badge shows whether the check came from the Internet or the office LAN. The newest 10 outages are shown first; click Show 25 more to load older ones.
- If a web application firewall is blocking Lavawall's checks, click How to allow for that service for the steps.
How to document switch ports
- Click the switch, router or other device on the map.
- Under Ports and connections, click Add ports (or Edit ports if some are written down already).
- Enter the Port name or number as printed on the device, for example
Gi1/0/24or12. Use Add a range… to add several at once, for exampleGi0/1-48. - In Connected to, start typing a device name or address and pick it from the list, or type anything else, such as
Patch panel B-14. - Add the VLAN and Notes if you like, then click Save ports.
The device on the other end shows Plugged into with the switch and port, and the plot view hangs it under that switch with the port on the line.
How to print a network drawing
- Click Plot view.
- Choose the Paper (Letter to ARCH E, A3 to A0, or a 24 or 36 inch roll) and the Orientation.
- Choose Labels: Name and IP, or Name, IP, make/model, MAC.
- Choose Symbols: Standard (colour), or Outline (saves ink) for a plotter.
- Untick Routed / remote devices to leave out devices reached through a router.
- Click Print and choose your plotter or printer, or click Download SVG to open the drawing in Visio, Illustrator or AutoCAD, or send it to a print shop.
How to export the network
- Click PDF for a report or CSV for the device list.
- Click Show All Devices to show every device on the map instead of the first 50 per group.
Tips
- A small Lavawall badge on a device means it is managed by the Lavawall agent.
- An exclamation mark on a printer means low supplies; the Consumable Alert percentage sets when that happens.
- Settings open automatically when nothing has been discovered or configured yet.
- You can open Scanner & Monitoring Settings, Monitoring and Plot view while the rest of the map is still loading.
- Each site card can be collapsed by clicking its WAN line.
- When the plot view says names print very small, choose larger paper or a roll.
- A web page title such as "403 Forbidden" is never used as a device's name; the device shows its address instead.
- In a high-availability setup, use Allowed WAN IPs and Allowed Gateways (or the auto-fill button) so only scanners at the right sites run monitoring. Accept monitoring from all locations turns that restriction off.
Troubleshooting
- "Please select a company from the dropdown above to view the network diagram."
- Choose a single company.
- "LAN Scan is not part of this company's plan…"
- Choose another company, or add LAN scanning to this company's plan.
- A segment is missing from the map.
- Segments with no devices are hidden. Open segments with no devices (hidden) under the map to see them.
- There's no Add ports or Edit ports button.
- Documenting ports needs a role that can change settings, such as an administrator.
- "No monitored devices found."
- Turn on monitoring with the Monitoring button.
- Checks fail but the site works.
- A web application firewall may be answering Lavawall's checks. Use How to allow in the monitoring report.
Task guides that use this page
Related articles
Still need help?
Search the support centre, or contact our support team and tell us which page you were on:
- Chat now: use the chat button in the bottom-right corner of this page to reach our team right away. Where cookie consent is needed, the chat starts after you accept (cookie settings).
- Email: send our support team a message through the contact page. It goes straight to a person.
- Phone:
 AB: 1-403-538-5053
 US: 1-406-988-7333
 UK: +44 20 3695 9786
Names, companies, devices and figures in the pictures are examples. Other product and company names are trademarks of their respective owners.