Dashboard overview
One view of every client and every device.
The Lavawall® executive dashboard pulls patching, detection, compliance, and support into a single multi-tenant view. See posture across every client at a glance, spot the environments that need attention, and drill straight into any device, without stitching together a handful of separate consoles.
Open the dashboard free What you see
Multi-tenant · posture at a glance · drill to any device · one agent
See it in the Lavawall® console
Real screens, shown with example data.
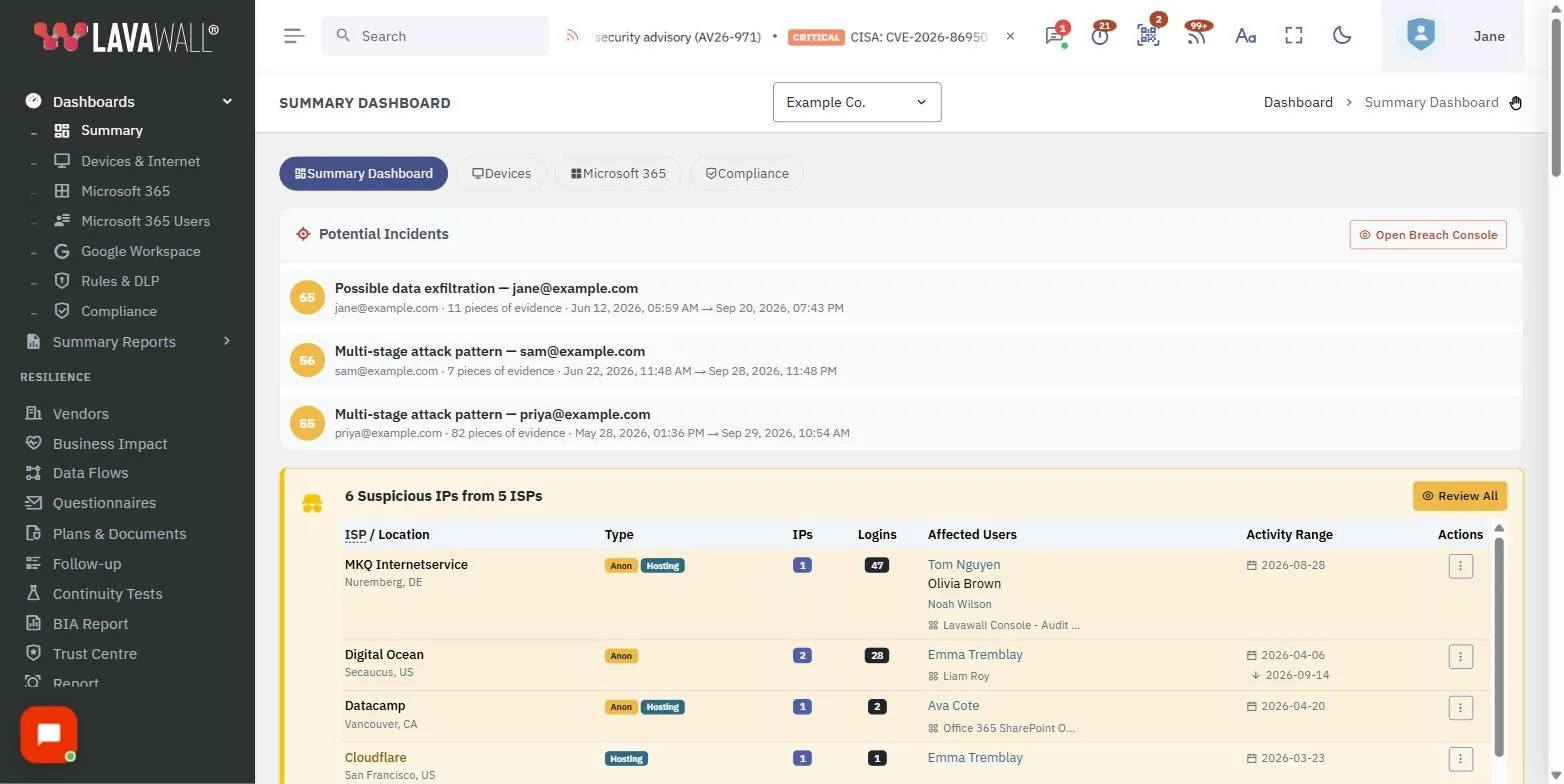
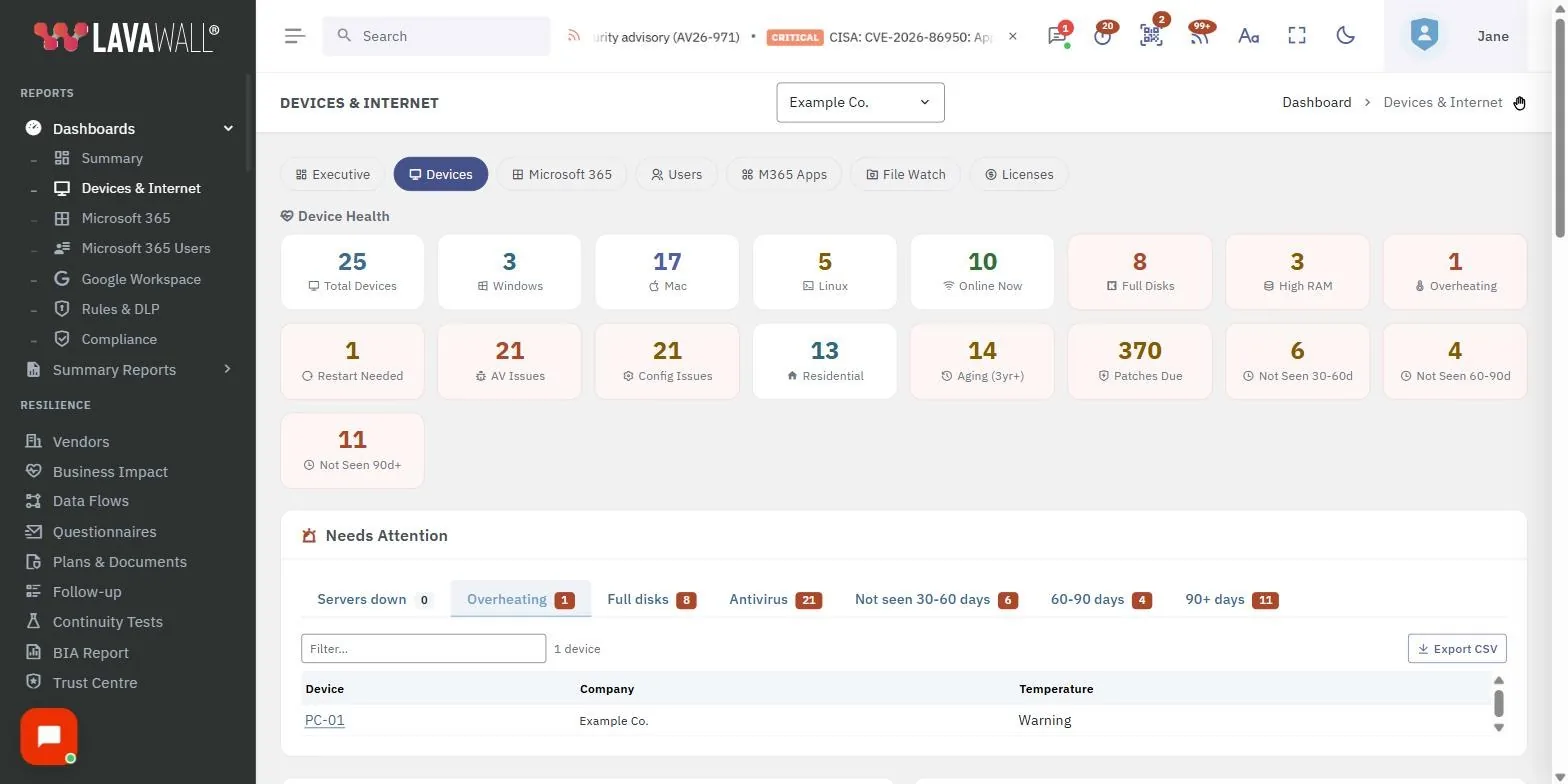
The whole environment on one screen
Most IT teams run patching in one tool, detection in another, compliance in a third, and support in a fourth. Each has its own dashboard, and none of them agree. Lavawall® collects all of it through a single agent and a single console, so the overview shows one honest picture instead of four partial ones.
From the top level you can see where the risk is (an outstanding patch backlog, a security event, a compliance gap, or a device at the end of its life) and move toward it without changing tools.
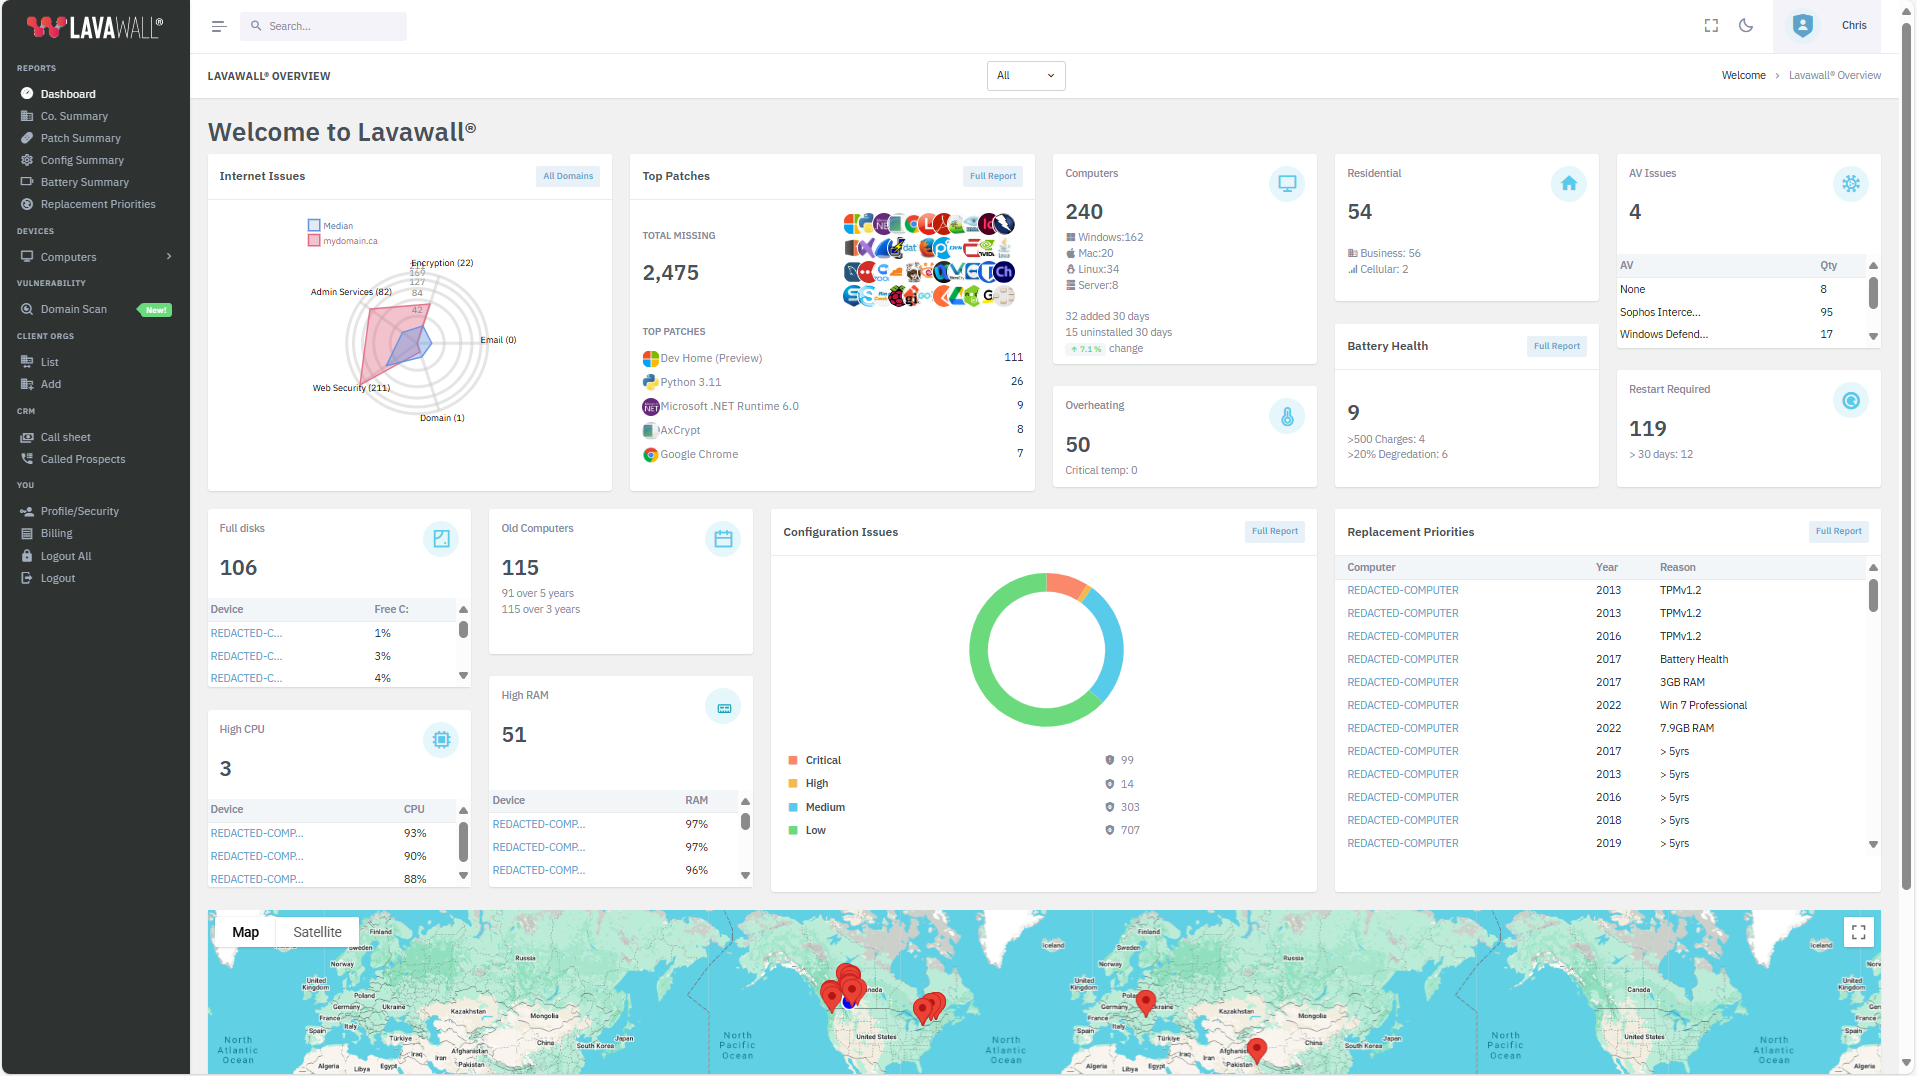
What the overview brings together
Patch and computer health
Cross-platform patch status and device condition for Windows, macOS, and Linux, so you can see what is out of date and what is ageing out.
Detection and security events
Breach detection and risk-based alerts surface the events that matter, sorted by severity rather than buried in a raw feed.
Compliance posture
Control coverage across the frameworks you map to, updated as the fleet changes, so audit readiness is something you watch rather than scramble for.
Configuration and change
Configuration assessments and change tracking show where settings have drifted away from a secure baseline.
Performance and event logs
Performance metrics and an intelligent event-log view make it easy to move from a symptom to the machine behind it.
Support and reporting
Help desk activity and automatic report generation round out the picture, ready to hand to a client or an auditor.
Built for the MSP multi-tenant reality
An MSP manages many environments at once. The Lavawall® dashboard rolls every client company into a single console so you can compare tenants, find the ones falling behind, and act, all without a separate login per client.
The view moves cleanly between levels. Start at the fleet, open a client company to see its devices, alerts, and posture, then open a single device for its patch status, configuration, performance, battery, and security detail. The same drill-down works for a lean internal IT team watching one organization, just without the tenant switching.
Frequently asked questions
- What does the Lavawall dashboard show?
- A single view of the whole environment: patch and computer health, detection and security events, compliance posture, and support activity. Because one Lavawall agent feeds every module, the dashboard reflects real fleet state and updates as the environment changes.
- Is the dashboard multi-tenant for MSPs?
- Yes. An MSP sees every client company from one console, can compare posture across clients, and can drill into a single company or device without switching tools or logins.
- Can I drill from a summary down to one device?
- Yes. Start at the fleet or client level, open a company to see its devices and events, then open an individual device for its patch status, configuration, performance, battery, and security detail.
- Do I need to configure reports to get value on day one?
- No. The overview is populated automatically from the data the Lavawall agent and cloud connectors already collect, so posture, alerts, and health appear as soon as devices and tenants are connected.