Smart event log analysis
A smart event viewer that reads the logs for you
Lavawall® collects Windows, Mac, and Linux event logs ahead of time and highlights the issues that matter, with counts across the last 24 hours, 7 days, and 30 days. Search with plain words instead of cryptic error codes, and get notified on BSODs and other impactful events before a client ever calls.
Start free, no credit card See how it works
Windows · Mac · Linux · instant · searchable · notified
See it in the Lavawall® console
Real screens, shown with example data.
Instant, intelligent event logs
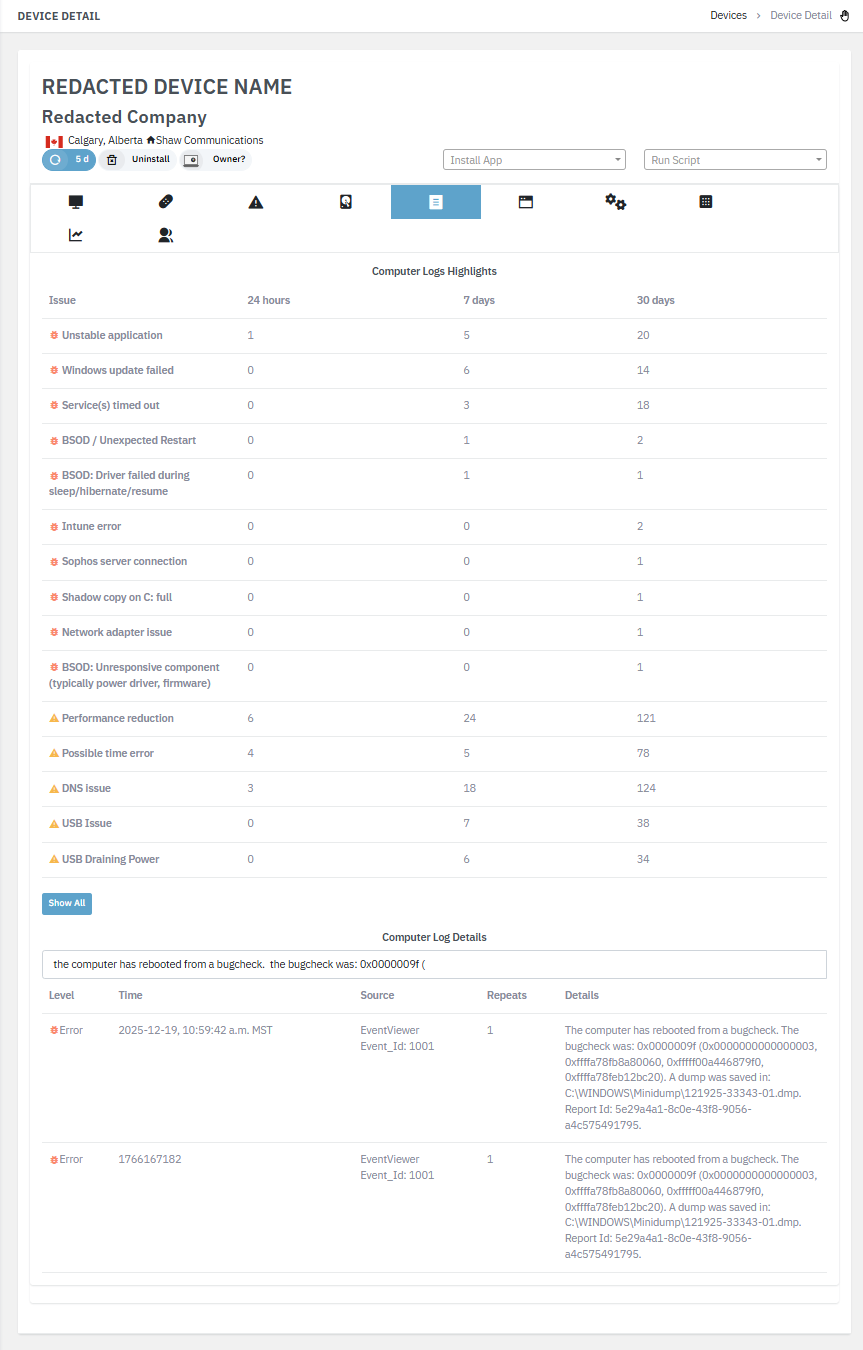
Open the event tab in a device detail screen and the logs are already collected and waiting. There is no need to wait for a remote session to connect to Windows Event Viewer before you can start looking. The tab appears once logs have been gathered for that device.
The top of the view shows the highlighted issues on the computer: the key problems and how often each one has been seen within the last 24 hours, 7 days, and 30 days. The Time column shows when an error last occurred and the Repeats column shows how often it has been observed. Click any highlight row and Lavawall® fills the search box and shows the detailed entries.
Only the most recent entries load at first, and as you type in the search field the loaded events filter with every keystroke. When you need to go deeper, a Search All button looks across every observed entry. Because the search understands plain language, you can look for something like graphic rather than remembering that a bugcheck 0x0000019c is a BSOD usually caused by a graphical component.
What it watches and warns on
Crashes and BSODs
Notifications for BSODs and unexpected restarts, so you can reach out proactively and check which other computers show the same fault.
Hardware and driver faults
Disk health issues, memory access errors, driver and firmware problems, GPU stalls, and sleep or resume failures, translated into readable descriptions.
Update and service errors
Windows update failures, system update service errors, services that fail to start or time out, and Intune errors that need attention.
Security and antivirus signals
Antivirus issues, Secure Boot not enabled, domain controller not available, and Huntress incidents surfaced alongside the log context.
Resource and stability issues
High CPU, RAM, or temperature, out of memory, C: full, applications that stop responding, and processes that behave unstably.
Network and connectivity
DNS issues, network adapter faults, USB problems, patching blocked, and a device moving to a residential Internet connection.
This is not an exhaustive list. Lavawall® continuously adds new notifications based on the failures it sees in the wild.
Notifications you can actually manage
Event-based notifications come from three sources: the event logs themselves, process resource usage, and device changes. The bell icon at the top right gives quick access to recent notifications, which you can browse by category or in reverse chronological order and search by keyword or by computer name or nickname.
The quick list holds the latest entries and deliberately leaves out noisy events like NTP time synchronization, which Lavawall® labels a possible time error, and processor auto-throttling, which it labels a performance reduction. For the full history, the Notifications option in the left menu lets you sort by device, category, criticality, description, company, and time. Notifications flow into the email digests, and you can ignore a known issue from this page so it stops alerting you repeatedly.
Why it matters
Reading raw event logs is slow, and most of what scrolls past is noise. By collecting the logs ahead of time, highlighting the real issues, and translating error codes into plain descriptions, Lavawall® turns hours of digging into a few seconds of reading. A technician can spot the pattern, see which other machines are affected, and act before a small fault becomes a client-wide outage.
The proactive notifications change the relationship with clients. Instead of waiting for a frustrated call, you reach out first about the crashing laptop or the failing drive, which lowers ticket volume and raises trust at the same time.
Frequently asked
- Do I have to wait for an RMM session to read the event log?
- No. Lavawall® collects and analyzes event logs ahead of time, so you open the event tab in the device detail screen and the logs are already there. There is no waiting for a remote session to connect to Windows Event Viewer before you can start looking.
- How does Lavawall® analyze the logs instead of just showing them?
- It highlights the key issues on a device at the top of the event view, with how often each one has occurred within the last 24 hours, 7 days, and 30 days. Clicking a highlight fills the search box and shows the detailed entries, and the search filters loaded events with every keystroke so you can look with plain words like graphic instead of decoding a bugcheck code.
- Will it tell me about crashes and BSODs?
- Yes. Lavawall® raises notifications for BSODs and other impactful events, so you can reach out to a client before frustration builds or a ticket is even opened. You can also check quickly which other computers are affected by the same issue.
- Which operating systems are covered?
- Windows, Mac, and Linux. Event log collection and analysis covers all three, so a mixed fleet is handled from one console instead of three different native log viewers.