Processes & performance
A historical task manager for your whole fleet
Lavawall® keeps long-term CPU, RAM, network, storage, and temperature trends for Windows, Mac, and Linux, so you see the full history of a device instead of a single moment. Zoom from a year down to a day, see which process caused a spike, and catch memory leaks and failing drives before they become tickets.
Start free, no credit card See the metrics
CPU · RAM · network · storage · temperature · per-process
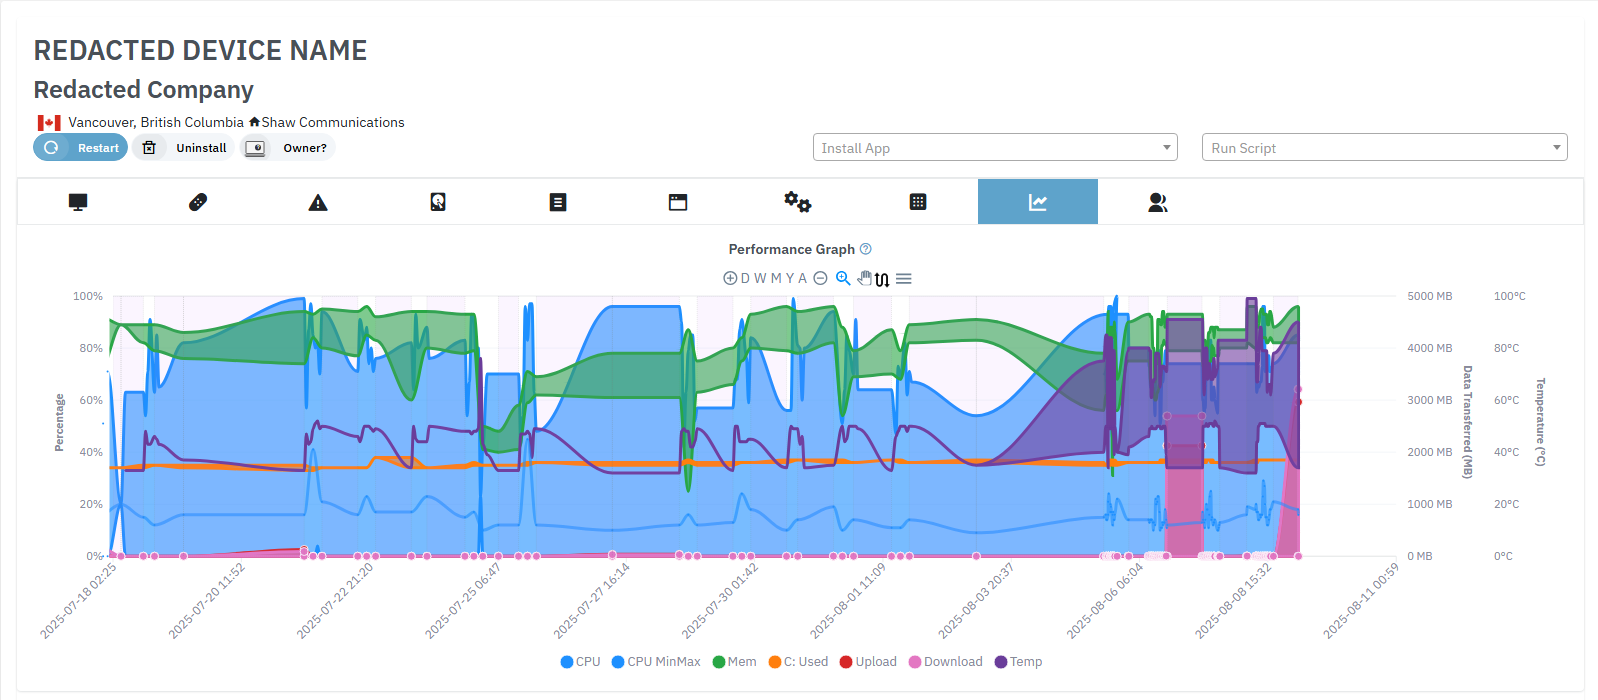
Long-term performance monitoring
Traditional monitoring tools give you sporadic bursts of data, so a problem that happened overnight is gone by the time you look. Lavawall® keeps the long-term trend, which lets a technician see across historical periods and find exactly when a performance issue began. Periods when a computer was off are shown with a grey overlay, and the most recent date is the device's last connection, so there is no guessing about gaps.
What it measures
CPU and RAM
Utilization trends over time, plus a current reading with a 30 minute trend that makes memory leaks and infinite loops easy to spot.
Network in and out
Inbound and outbound traffic trends, so a device pushing unexpected data or saturating a link stands out.
Storage
Primary and secondary drive usage over time, with current C: and D: capacity, so a drive filling up is caught before it stops the machine.
Temperature
Temperature trends alongside the other metrics, which helps explain throttling, instability, and hardware that is about to fail.
Per-process usage
The processes using the most CPU and RAM, each with a 24 hour trend. Any process using at least 1 percent of CPU or RAM is recorded.
Quick performance column
A 24 hour overview in the device list: blue for CPU range, yellow for network traffic, red for the primary drive, and purple for the secondary.
How the graphs work
Every statistic is a graph you can drive. Mouse over any point for the detail at that moment. Use the plus and minus controls to zoom, and the D, W, M, and Y buttons to jump to the last day, week, month, or year online. When you are zoomed in, the drag control scrolls left and right through time.
Lavawall® keeps the minimum and maximum over each 15 minute period and shows the maximum by default, and a single toggle switches the graph to show the full range instead. Any graph downloads as SVG, PNG, or CSV, and the CSV carries the minimum and maximum values, which makes it easy to drop into a report or attach as evidence.
In the device list, the quick performance column gives a 24 hour picture at a glance. Mouse over a line for a quick read or click through to the full graph. Below it, the current CPU and RAM readings carry a 30 minute trend, which is where a memory leak or an infinite loop shows itself first. Drive utilization and network transmission detail are available for Windows in the current mainstream release, with Mac and Linux arriving in the next release.
Why it matters
Intermittent performance problems are the hardest to solve, because by the time a user reports the slow machine the evidence is gone. A historical view lets you prove what happened, tie it to the process that caused it, and fix the root cause instead of rebooting and hoping. The same trends double as early warning: a drive creeping toward full, a temperature climbing week over week, or memory that never comes back down all show up long before they turn into an outage.
Frequently asked
- How is this different from Task Manager?
- Lavawall® keeps the history. Task Manager shows a single moment and only after it initializes and collects data. Lavawall® keeps long-term trends for CPU, RAM, network, storage, and temperature, so you can look back over the last day, week, month, or year and see exactly when a problem started rather than catching only what is happening right now.
- Can I see which process caused a spike?
- Yes. Process statistics show the processes using the most CPU and RAM, each with a trend graph over the last 24 hours. Lavawall® records any process that uses at least 1 percent of CPU or RAM, so a memory leak or a runaway process is still visible after the fact.
- Which platforms and metrics are supported?
- CPU, RAM, network, storage, and temperature trends are collected for Windows, Mac, and Linux. Drive utilization and network transmission detail in the quick performance view are available for Windows in the current mainstream release, with Mac and Linux being added in the next release.
- Can I export the data?
- Yes. Any graph can be downloaded as SVG, PNG, or CSV, and the CSV includes the minimum and maximum values recorded over each 15 minute period, which is useful for reports and for evidence.