Next Level Performance Monitoring
As a Managed IT Service Provider (MSP), we hated having to wait for Event Viewer or our RMM's real-time performance statistics to open up to resolve problems.The RMMs we used gave bursts of information when the computer was on, but long-term trends were hard to decipher; process data was only real-time, and figuring out where our clients' performance issues were required us to see the problem at the right time.
Lavawall® changes the game.
Comprehensive Statistics
In the device details, you can quickly see CPU, RAM, Network (in and out), storage, and temperature trends.Periods when the computer was off are indicated by a grey overlay.
Note that the graph loads from most recent to the past and will continue to load older data. The most recent date is the last time the computer was connected.
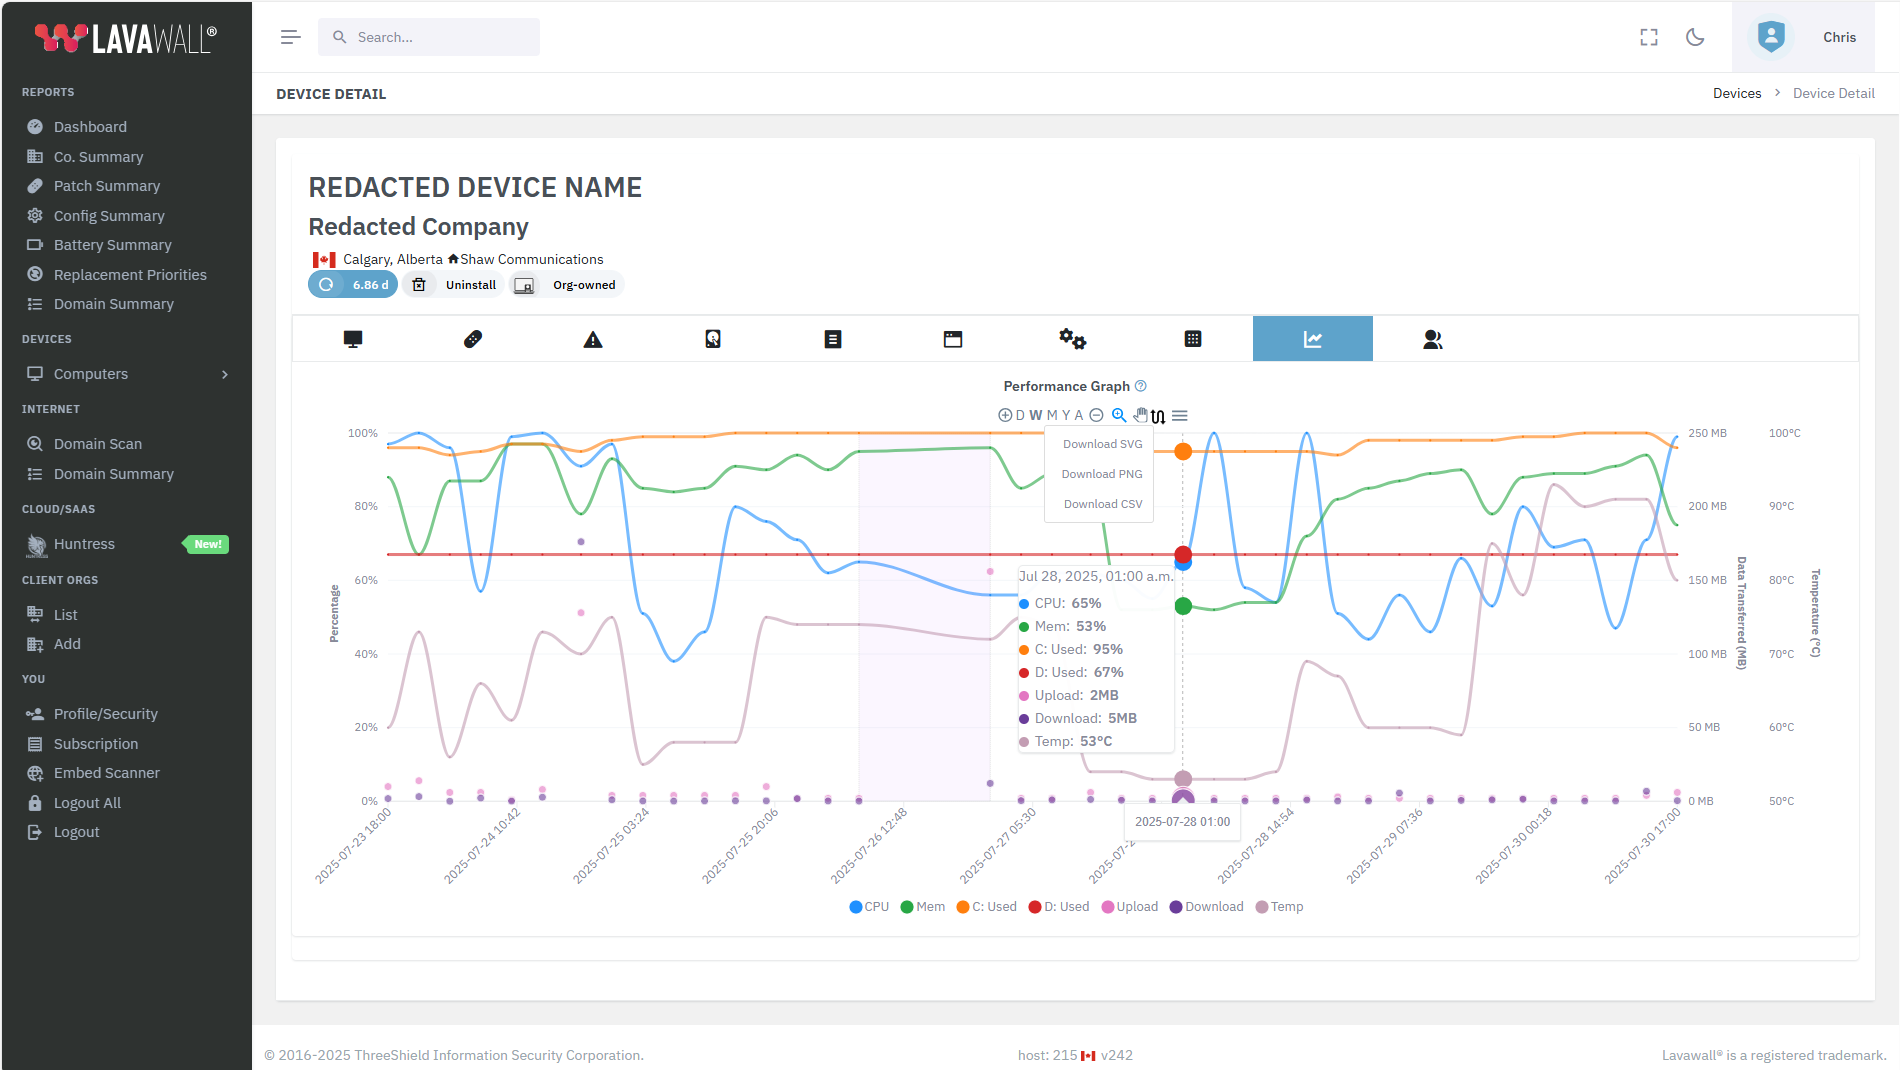
Mouseover any point in time to see the detailed statistics.
to zoom in.
Click then select any area of the graph to zoom into that area
Click to zoom out.
Click D for the last day the computer was online.
Click W for the last week the computer was online.
Click M for the last month the computer was online.
Click Y for the last year the computer was online
Click and then drag the chart left and right to scroll if you're zoomed in.
Click and then download the graph or related data in SVG, PNG, or CSV format. CSV downloads the minimum and maximum values.
Click
 to see the ranges during each sample period (Lavawall® keeps track of the minimum and maximum over each 15-minute period, but only displays the maximum unless you click this mode).
This is an example of the range view:
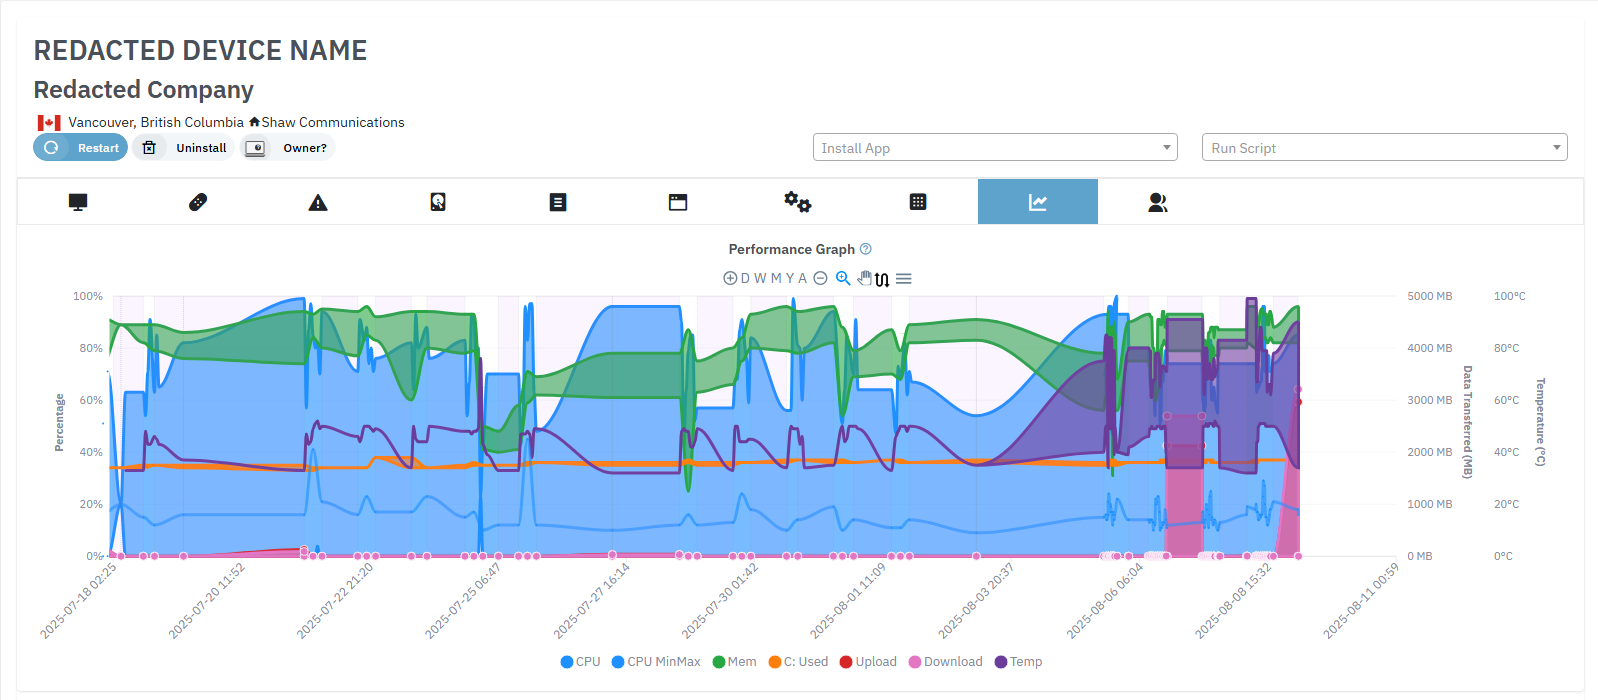
For most metrics (memory, drive utilization, upload, download, and temperature), Lavawall shows the maximum value in the regular view and the minimum and maximum in the range view. We check for these values as often as every 15 and store the minimum and maximum from these readings every 15 minutes.
As such, momentary spikes can significantly change the average. This isn't usually a big deal for things like disk space and temperature that typically change fairly slowly. However, modern multi-core CPUs are very dynamic. Many RMMs missed this dramatic change and misreport CPU utilization as a result.
Given how much CPU utilization can change within a 15-minute period, we show the average CPU utilization along with the minimum and maximum in the range view. In the regular view, the average CPU utilization is shown. This "average" value (divided by cores) is what you see in Windows Task Manager as well.
Without this subtle detail, technicians tend to respond to maximum values as a "pinned CPU" and waste unnecessary time looking for out-of-control processes.
Quick Performance View
The Performance column in the device listing page gives a quick view of performance trends over the last 24 hours.Blue shows the CPU range in each 15-minute period
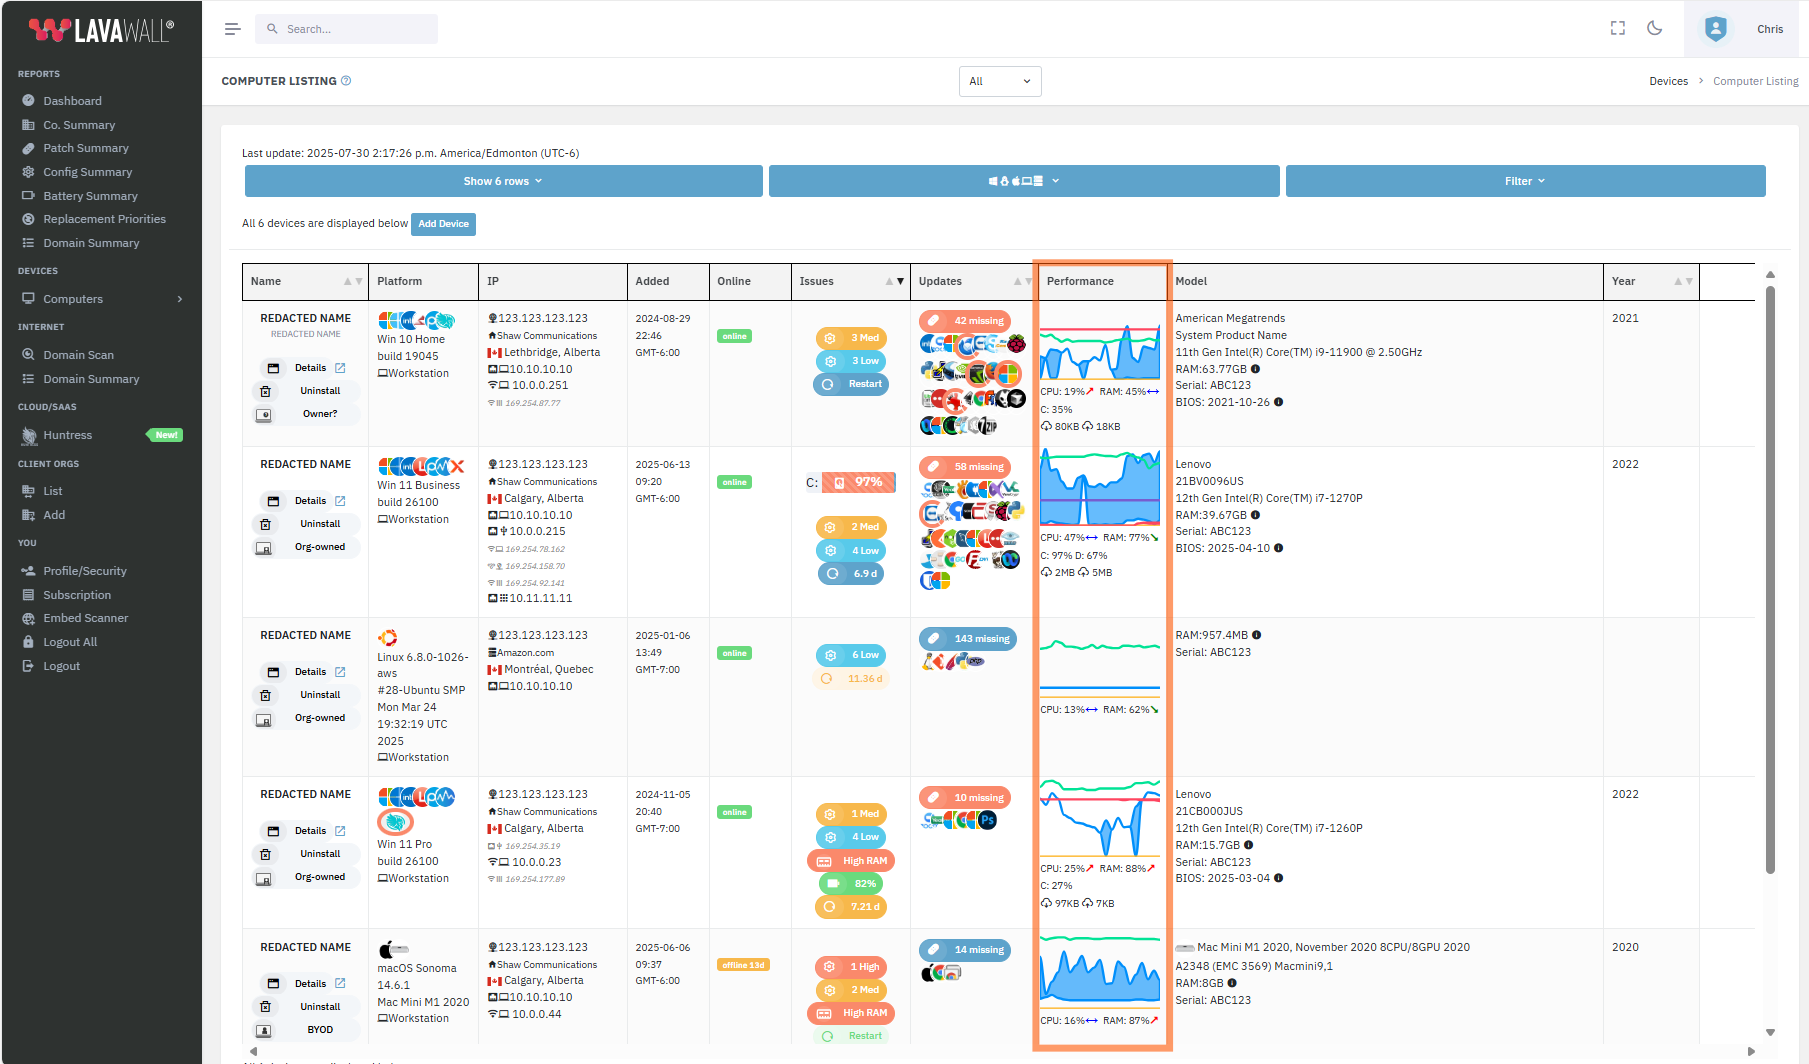
Yellow is the total network traffic trend (Note: In this view, network is the amount of data in that period. In the detail view, it's the amount of data since the last reboot)
Red is the primary storage drive
Purple is the secondary drive.
You can mouseover the lines to get quick details or click the graph to go immediately to the detailed graph tab shown above.

Under the graph, you can see the current CPU and RAM utilization as well as the trend over the last half hour. This is useful to catch memory leaks and infinite loops.
When CPU utilization is currently 0%, it is not displayed in this view; however, it is displayed in the detailed view.
Below CPU and RAM, you can see the current C: and D: drive capacity as well as the amount of data downloaded and uploaded.
Drive utilization and network transmission is shown for Windows in the current mainstream release.
We are adding Mac and Linux in the next release.
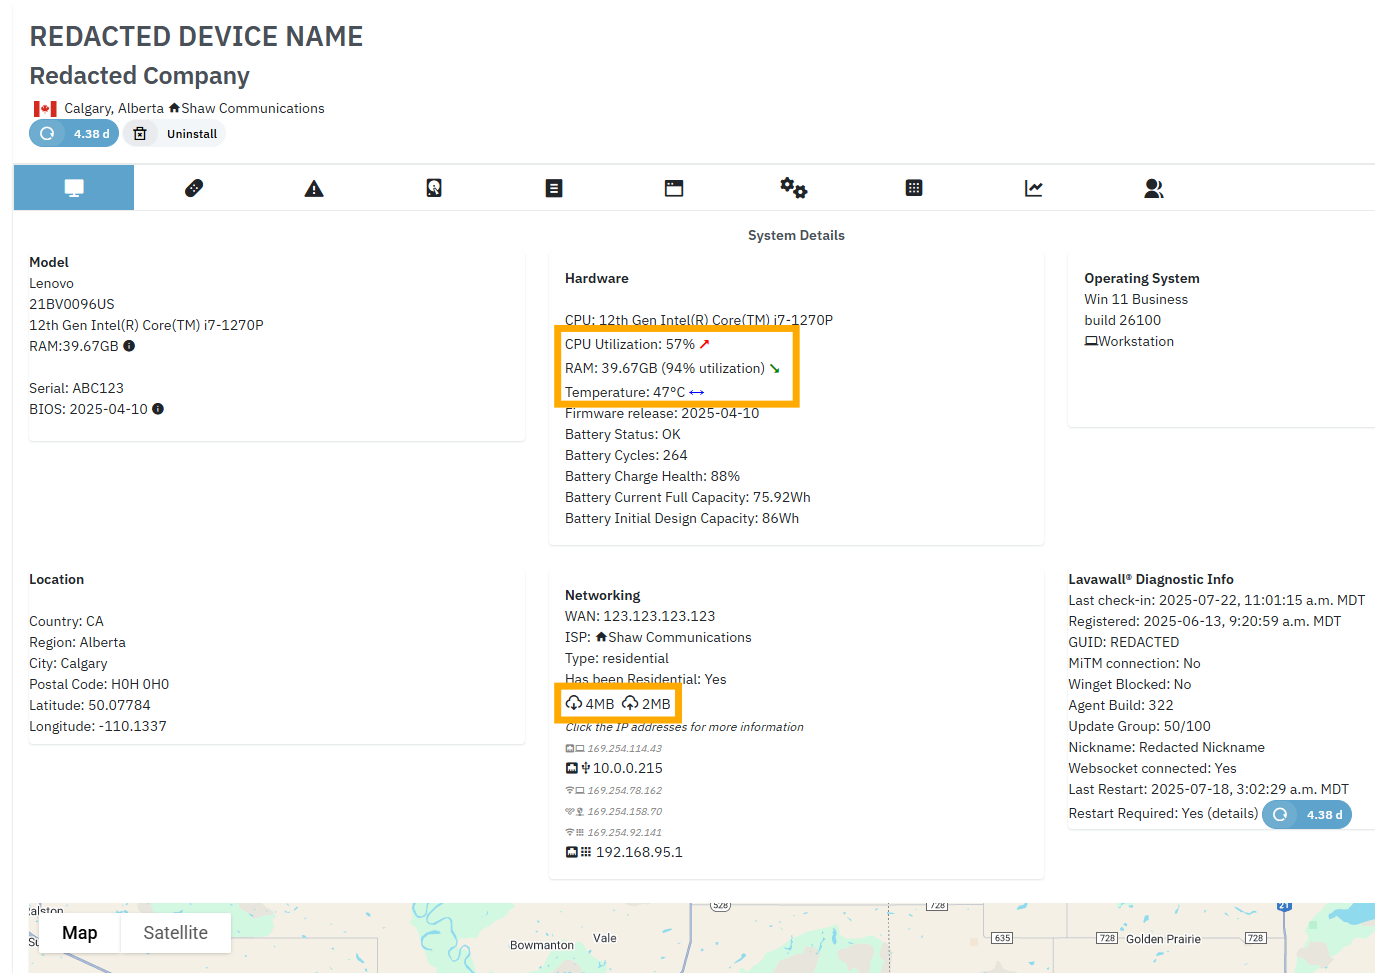
This information is also available in device detail by clicking the Details button in computer listing or searching for the device in the Search box at the top of the screen.
Process Statistics
Don't wait for Task manager to open up and collect information. Get an instant view of the processes that use the most CPU and RAM on a device, including a graph that shows the trend for that process over the last 24 hours.
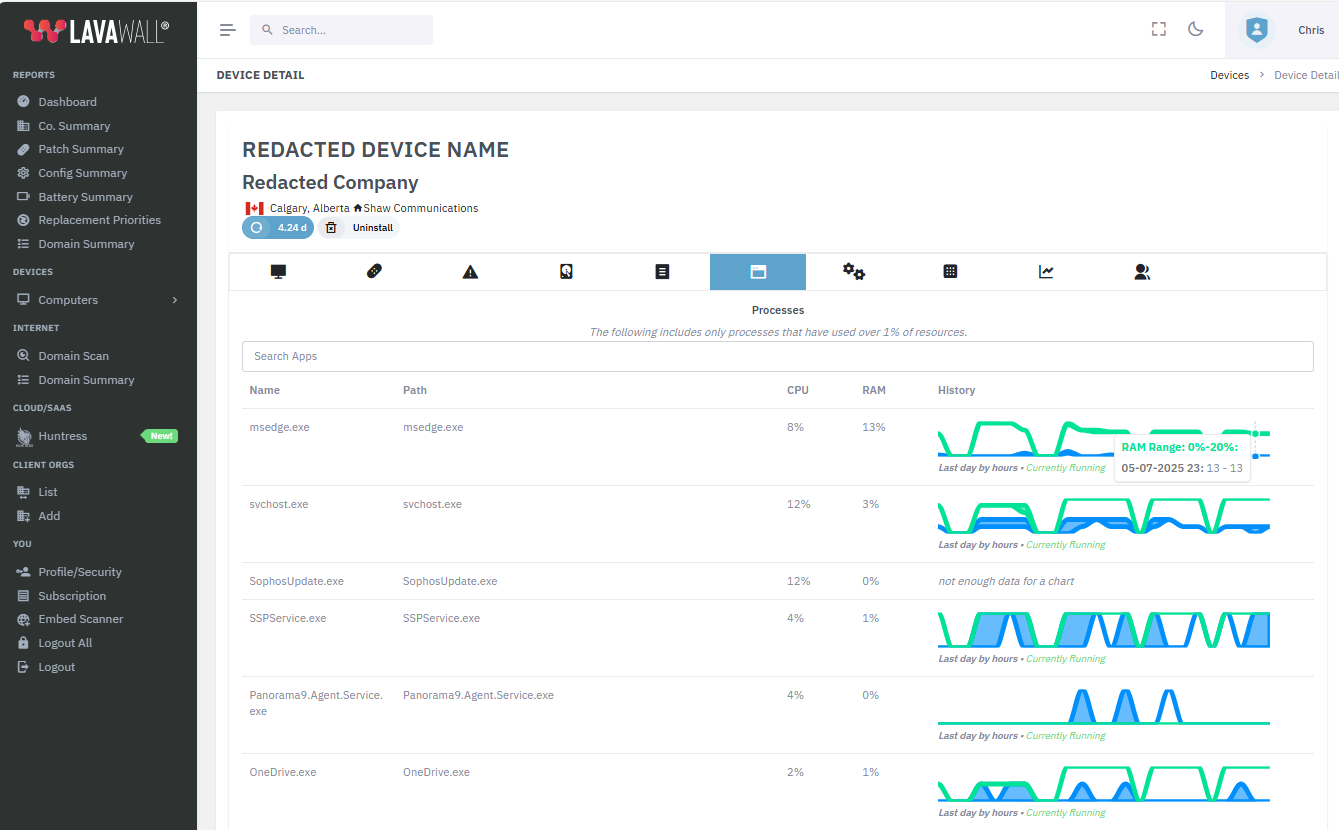
You can mouseover the graph to see the details for CPU and memory. We only record processes that use at least 1% of RAM or 1% of CPU.
Under the chart, you will see a green indication if the process is currently running.
Processes that have historically consumed more than 1% of resources are listed below. (If they aren't currently running, they will show 0% under CPU and RAM and wil not have the Currently Running comment.
You can also quickly search for processes by either their executable name or the program name in the search box, which updates the table with every keystroke.
If you have any questions or need further assistance, feel free to reach out through our chat, phone or email on our contact page!